What is data transformation and how does it work?
Learn what data transformation is and how it's used to modify, reformat, cleanse, and restructure data.
Luke Kline
January 25, 2023
|14 minutes

Every time a key stakeholder asks for a specific subset of data or report, a data analyst or data engineer in your company has to gather that information to answer the question posed. This process is known as data transformation, and it’s the backbone of any data integration, data migration, or data warehousing use case.
What is Data Transformation?
Data transformation is the process of modifying, reformatting, cleansing, or restructuring data to make it more useful for a particular business use case. The ultimate goal of data transformation is to build data models and establish KPIs you can use to govern your business decisions.

How data transformation works
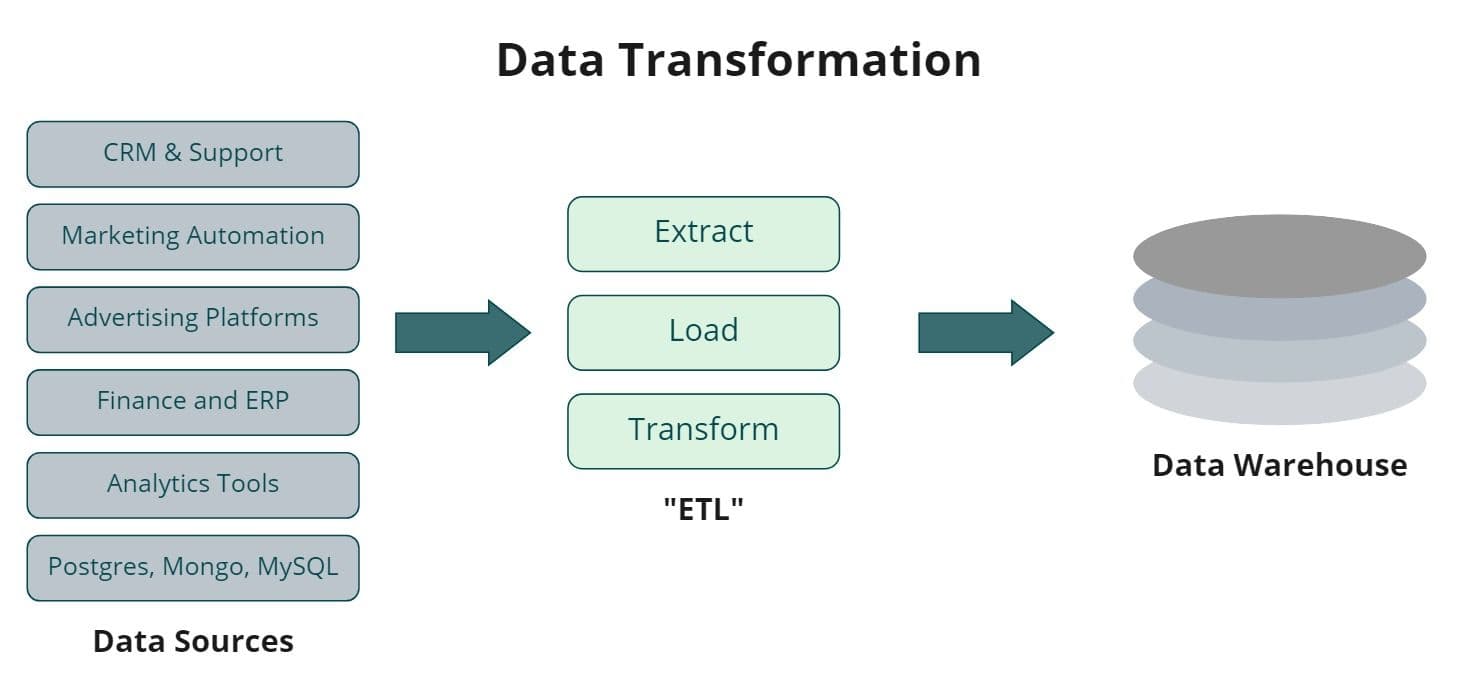
When data is extracted from a source system, it’s still in a raw form, which means it’s essentially unusable for any use case. Data transformation is a sub-category of data integration that falls into ETL (extract, transform, load.) Data transformation is the “T” aspect of ETL process.
Data transformation is the process of modeling your data and turning it into a usable format that aligns with the schema structure and tables of your data warehouse or target database. Data transformation also allows you to merge the data from your disparate data sources and build cohesive data models for your business.
How Data Transformation Works?
There are four core components to the data transformation process. The most basic level of data transformation is simply dropping and deleting unneeded columns, filtering out rows, capitalizing fields, etc.
The second pillar of data transformation is modifying the values of data. This step includes anything from updating capitalization and spelling errors, excluding and filtering out specific records, or even combining values like first and last names. The third pillar of data transformation is changing how values are interpreted and updating data types. For example, you might need to change a text field to an integer so you can perform mathematical operations.
Once your data is in a clean state within your warehouse, it’s’ ready to be used for granular analysis, so the fourth pillar of data transformation is joining all of your various tables and merging those datasets so your analysts can start querying your data to build models and KPIs to power your business decisions.
How Data is Structured?
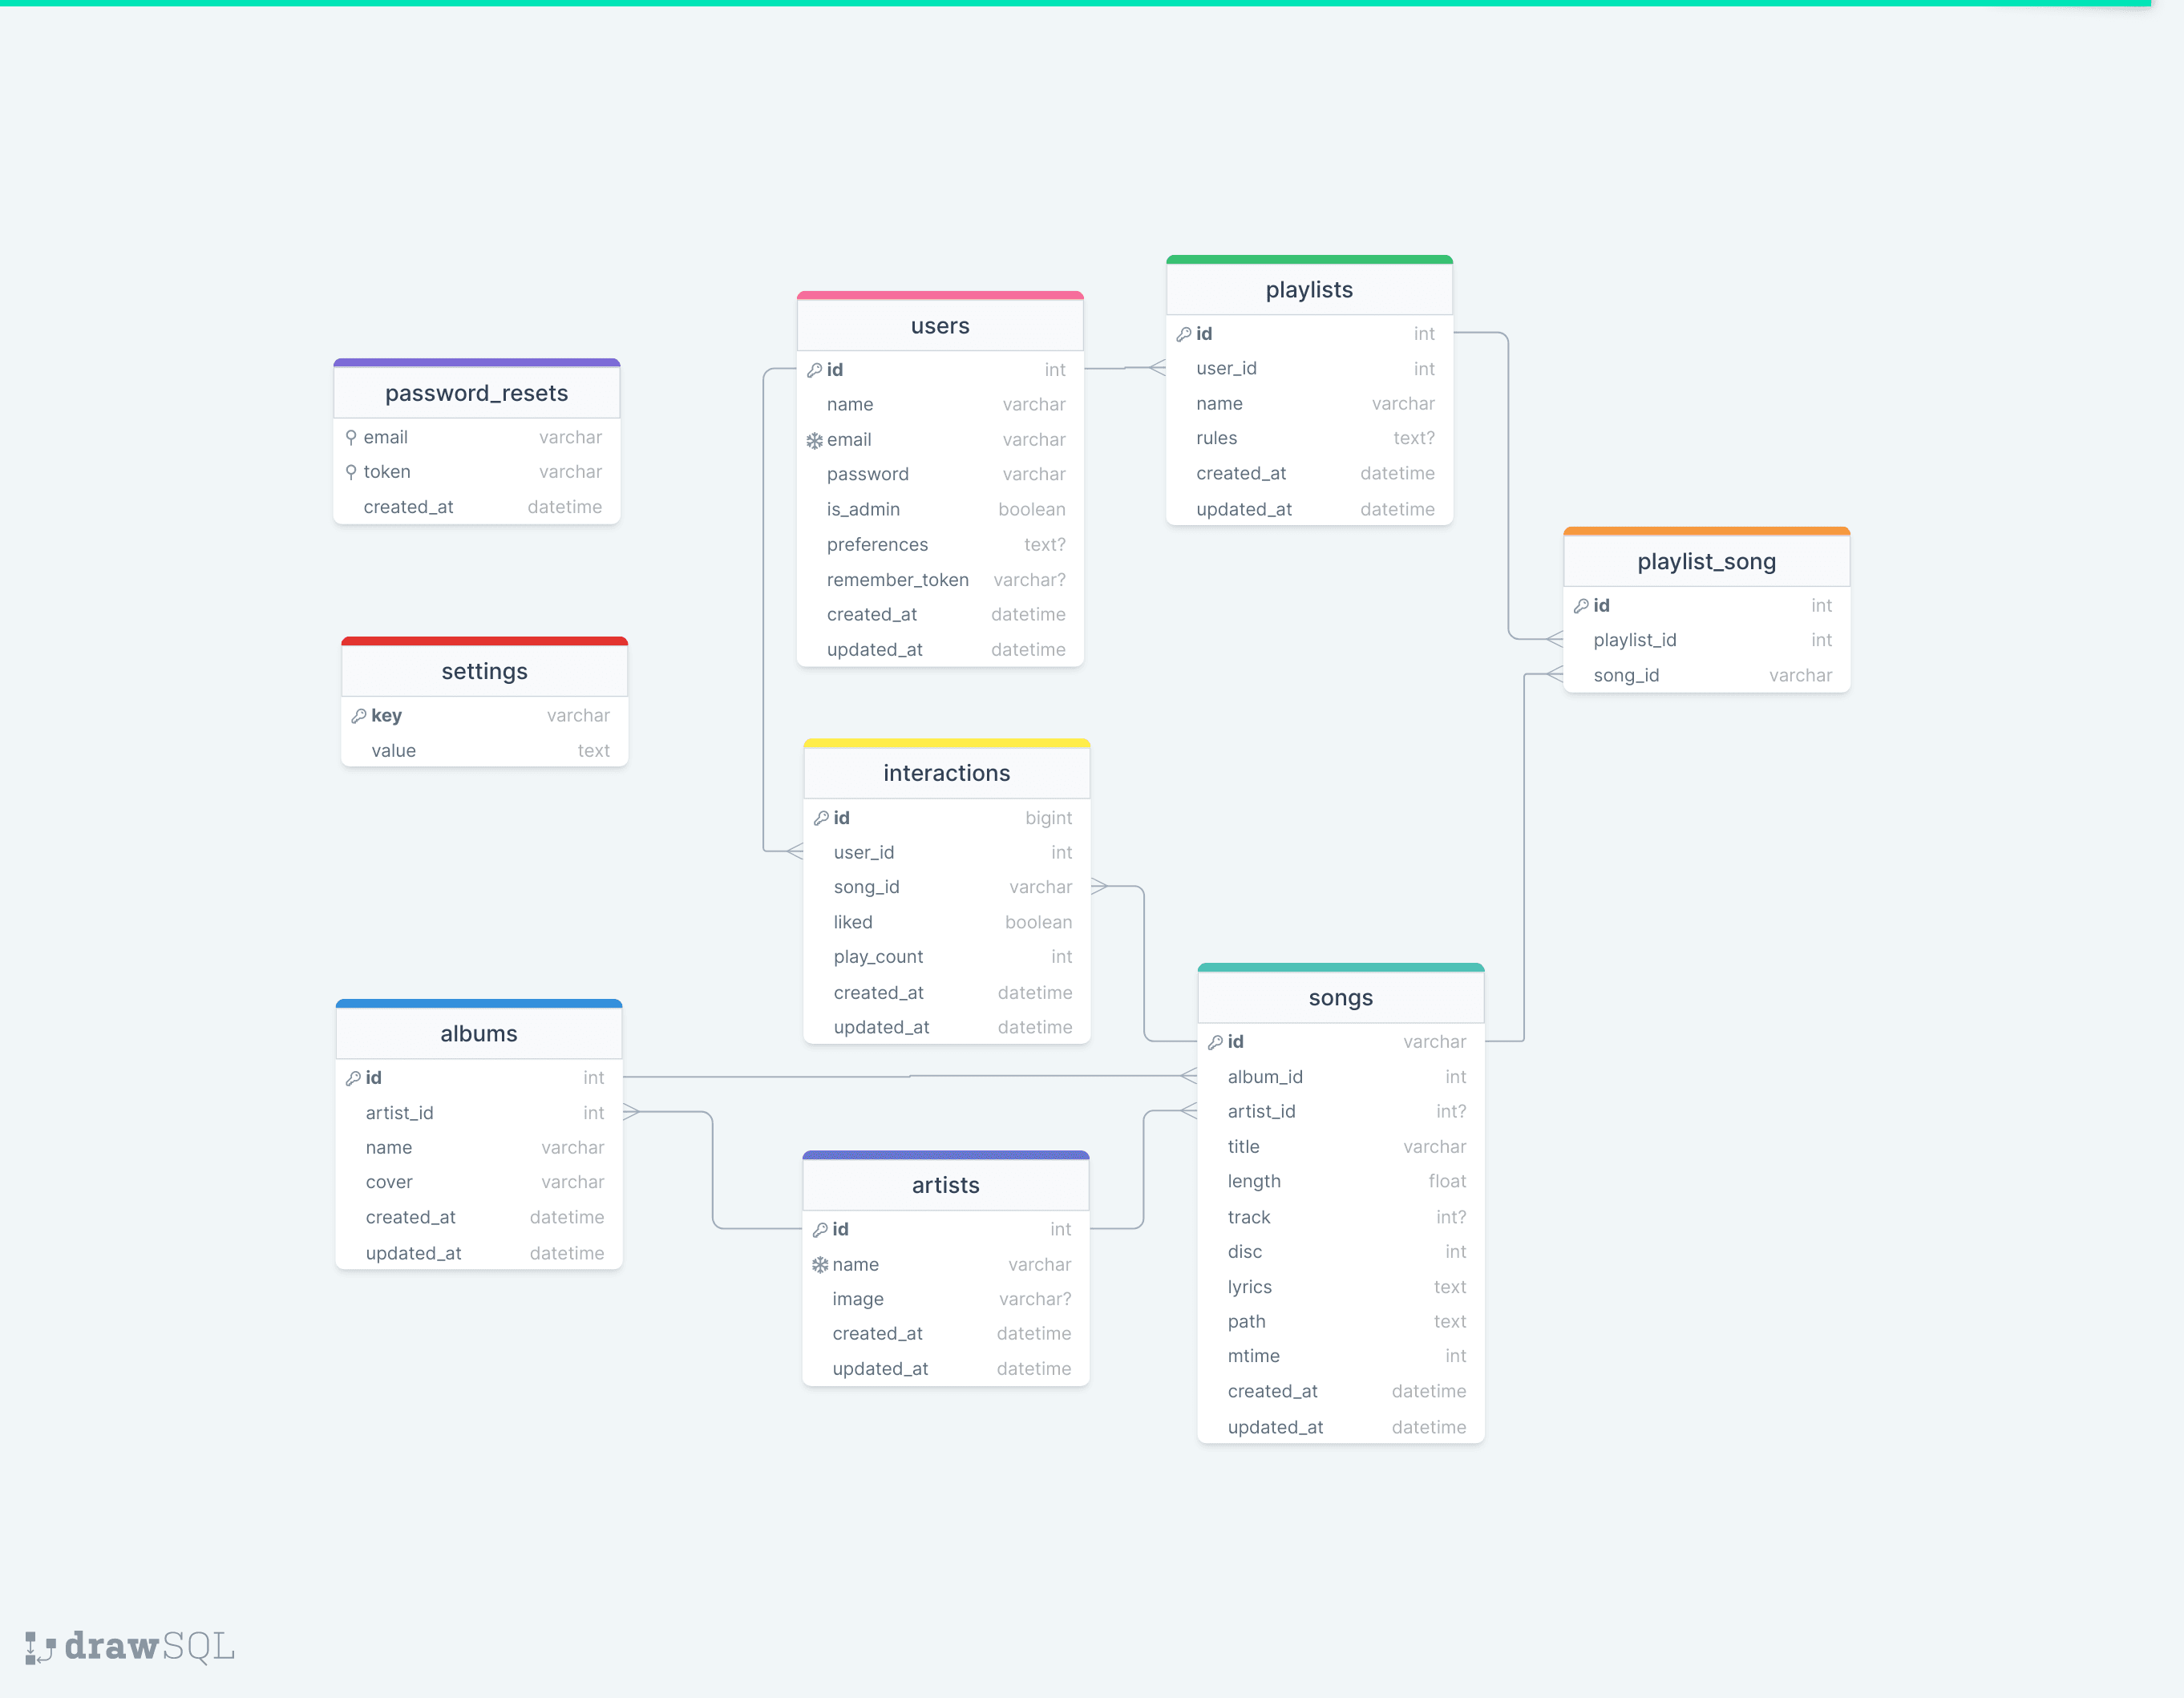
Before understanding how data transformation works, you must first understand how data is structured. For the most part, data is stored in relational databases. Every relational database has a few core components:

Database schema example using drawSQL
- Objects/Tables define how your data is organized and refer to specific entities like users, customers, products, companies, orders, etc.
- Columns are the vertical elements that make up tables. This includes all of the data points you track within a given object. (e.g., email address, order ID, phone number, first name, last name, etc.)
- Rows/Fields fall underneath columns. This is where the actual data points for individual columns are held. Every row represents a single entry in a table (e.g., john doe, john@abc.com, 123-456-7891.)
- Primary Keys are the unique identifiers that are used to establish relationships between tables and different rows. For example, every customer might have a unique customer_id. Primary keys exist to help uniquely identify table records so that key fields can be associated with an individual object.
- Foreign Keys reference other tables’ primary keys to help link data between tables.
Data Types
Data transformation processes become even more challenging once you account for all the different data types and formats that define how your data is structured. Once you move outside of relational databases, everything becomes even more complicated. Here’s a list of the most prevalent data types and formats found in relational databases.
- Strings represent sequences of digits, characters., or even symbols. An example might be a name (John Doe) or a phone number (222-555-8888.)
- Integers represent any number, excluding fractions.
- Floats are meant to represent numbers with factions (.03, 100.4)
- Booleans are true or false values where “1” equals true and “0” equals false.
- Dates are helpful for historical record keeping. They’re formatted as YYYY-MM-DD (2023-01-18.)
- Time is used to define the amount of time that’s elapsed since a specific event or even capture the time interval between events (e.g., the last time an email was opened.) It’s formatted as HH:MM:SS (e.g., 13:28:32.)
- Datetimes represent the date and time consolidated together in the format of YYYY-MM-DD and HH:MM:SS (e.g., 2023-01-18 13:28:32.)
- Timestamps help identify when a specific event occurred and record the number of seconds that have transpired.
- Arrays designate a one-to-many relationship between columns and rows. For example, if you have a recipe column (e.g., recipe_id: 123456) you can associate those individual numbers with ingredients (e.g., ingredients: “flour,” “sugar,” “eggs”.)
- Enumerations list elements of the same type in a particular order, and they’re limited to a set of predefined values. For example, if you have a column for a product, you might have a drop-down list for all your products (e.g., shoes, laces, socks, etc.)
Data Transformation Processes and Techniques
Your data transformation technique will largely depend upon the volume and format, and the frequency at which you need it transformed. For the most part, there are three main data transformation processes:
Warehouse-Driven SQL Transformation
SQL is essentially the standard language for manipulating relational databases because it’s relatively easy to use, and performing operations like inserting, updating, or retrieving data is pretty straightforward.
Since cloud data warehouses tend to be built around relational databases and optimized for SQL, SQL is the first choice for most data engineers and analysts because it addresses most out-of-the-box use cases. Most people prefer SQL because it’s simple and direct. SQL can accomplish a surprising amount before you need an actual programming language, and it scales well.
Transformations in Code
Unfortunately, SQL doesn’t make sense for every workload because it’s not a full-blown programming language. This is where other development languages, like Python, Java, Scala, etc., come in. These languages are much more flexible than SQL because many libraries and packages can help you do just about anything, especially since SQL is not built for tackling data science and machine learning use cases.
Programming languages are much more flexible than SQL because they’re not just built for relational databases, and since many data platforms now support them, they can be a great option. The downside to programming languages is that many users only know SQL, so writing code this way is not nearly as scalable or manageable as SQL.
GUI-Based Transformations
Graphical user interface (GUI) transformations are typically the first choice when development languages are not in the picture. These paid products tailor toward non-technical users, and they enable you to manage your transformations with a relatively easy drag-and-drop interface.
The downside to this approach is that it’s not nearly as robust as executable code, and it’s tough to optimize for your use case. GUI-based transformations can be an excellent choice for straightforward use cases, but they become nearly impossible to scale and maintain for anything complex.
Data Transformation Examples
In the extraction phase, your data is extracted from the source and copied to your target destination. Any initial transformations are simply to ensure that the format and structure of your data is compatible with your end system and the data that already lives there.
Extraction
In the extraction phase, your data is extracted from the source and copied to your target destination. Any initial transformations are simply to ensure that the format and structure of your data is compatible with your end system and the data that already lives there.
Mapping
Data mapping involves taking specific objects and fields from your source and syncing that data to your target database table. This transformation step is all about ensuring that your data is formatted appropriately.
Aggregration and Filtering
Aggregation and filtering makes your data more manageable and consumable by removing specific objects, columns, and fields that don’t apply to your downstream use cases.
Imputation
Imputation is the process of aggregating or separating data. For example, you might want to calculate the total of every customer order and do a summation of the total or separate fields into multiple columns.
Ordering and Indexing
You’ll need to optimize your query performance in many scenarios to pull data more quickly. Ordering your data enables you to group it based on specific values in a column so you can arrange it in a particular order (e.g., ascending or descending.)
On the other hand, indexing lets you optimize how the data is structured in your tables so you can access it more quickly and run faster queries. You can find specific users faster by creating an index on a field like user_ID.
Encryption and Anonymization
Data can often have personally identifiable information (PII) that risks compromising security and privacy. Anonymizing and encrypting data is a requirement for many privacy regulations, such as GDPR and HIPAA.
Anonymization replaces fields with randomized values to make it challenging to re-identify individuals, and encryption makes fields unreadable unless you have access to a decryption key.
Formatting and Renaming
Formatting and renaming refers to manipulating data so it’s easier for you to consume. For example, you might want to combine fields, adjust data types, or even change column names. Establishing a single format can help you optimize your data without losing context.
Steps to Data Transformation
Unfortunately, before any data transformation can take place, there are several steps you need to address. Data transformation and modeling go hand in hand, so you need to understand your objectives and goals from the start.
That means cataloging your source data to identify what data you need to transform. If you don’t understand the objects, columns, and fields in your data sources, you won’t have the visibility you need to run your transformation jobs and write your code.
It’s important to understand where the data is coming from, what it means, and if you have what you need to start building the resulting models from that data. On top of this, you need to know how your end database tables will be structured and what objects you’re looking to produce for your models.
Once you have all this in place, the next step is identifying a transformation engine and management framework to manage and run your transformation jobs and workflows. Even if you have all the skills necessary to write the best code in the world, you’ll still need some place to orchestrate and run everything.
Data Transformation Use Cases
Data transformation always stems from a request (e.g., Can you tell me how much revenue we converted from X marketing campaign? Can you give me a list of users who abandoned their shopping cart in the last seven days?) These requests can be linked to two use cases: analytics and activation.
Analytics
Analytics is using your data to generate unique insights about your business (e.g., business intelligence.) In most scenarios, this means having your analysts and engineers build data models to answer critical questions about your business and establish KPIs. For example, maybe you want to know:
- Which customers are at risk of churning?
- What percent of users got stuck in onboarding?
- How many new signups did you get last week?
- What is the total recurring revenue for X account(s)?
Ultimately, analytics use cases differ across industries, companies, and business models. The purpose of analytics is to provide direction for your business.
Data Activation
Data Activation use cases focus on using the insights you generated from analytics to drive action. Rather than staring at your data in a dashboard, Data Activation is all about taking the data from your warehouse and syncing it back to your frontline business tools so your business users can build more personalized customer experiences and streamline business processes.
Previously, syncing data back to your operational tools like Salesforce and Hubspot was challenging, but with Reverse ETL, that is no longer the case. You can arm your sales reps with product usage data in Salesforce or help your marketing teams build custom audiences so they can retarget them with ads.
Benefits of Data Transformation
Without data transformation, your data is essentially unusable. Data transformation allows you actually to leverage your data to drive value for your business. It improves the quality of your data and speeds up how fast you can answer critical questions and problem-solve for your business.
Ultimately, data transformation allows you to run faster and more complicated queries for your business and ensures that all of your data is readily available in a standardized format within your target destination (e.g., the data warehouse.)
Data Transformation Tools
There are many transformation tools on the market, but they all require you to build and maintain your own transformation logic, and each one tackles a slightly different problem
dbt
dbt is an open-source data transformation tool that runs directly on top of your data warehouse. dbt is a command-line interface that helps you compile, orchestrate, schedule, and execute SQL queries against your data warehouse. dbt helps you develop, test, and document all of your SQL-based transformations. You can manage everything with version-controlled code and define all the relationships between your models and SQL files.
In addition to this, dbt makes it easy to maintain documentation and build lineage graphs to manage all of the underlying dependencies in your code. dbt brings software engineering practices to the world of data engineering and helps you understand how all your SQL transformations relate to one another.
Airflow
Airflow does not help you transform your data in any way; it’s an orchestration engine for building and managing your data transformation workloads. Airflow is an open-source platform that lets you define, schedule, monitor, and run your transformation jobs. Airflow provides a rich user interface and lets you visualize data flows through DAGs (Directed Acyclic Graphs.) Airflow is a great framework and engine for running your data transformation jobs.
Matillion
Matillion is a GUI-based ELT tool that provides pre-built connectors to various data sources to extract your data. After your data has been extracted from your data source, Matillion ingests it into your warehouse. Once in your warehouse, you can use Matillion’s transformation components via a drag-and-drop interface or write custom SQL to transform your data. You can easily generate documentation, schedule and orchestrate jobs, and even run tests.
Informatica
Informatica has been around since the 90s and is one of the most prominent data integration tools. The platform addresses a wide range of data management, data quality, and data integration use cases. Like Matillion, Informatica also provides a GUI-based ETL tool that offers pre-built connectors to thousands of data sources and various transformation components to help you transform your data.
Datafold
Datafold addresses a slightly different problem for data transformation. Rather than focusing on the transformation aspect, Datafold focuses on lineage and governance, so you can see the impact your code will have on your downstream models and datasets.
The easiest way to understand Datafold is to think of it as a proactive data engineering tool that helps you detect and identify potential problems in your code before things break. Datafold’s diffing tool checks changes in your data pipeline and highlights how those changes will affect the data produced. Datafold essentially lets you automate code reviews and approvals for your data transformations.
Final Thoughts
Data transformation is a vital aspect of the data ecosystem, and if you want to use your data business intelligence or activation. Unfortunately, there’s no one-size-fits-all, cookie-cutter solution to data transformation. Your transformation requirements will depend solely on the downstream models you’re building and the use cases you want to address.


