Introducing the live debugger
Introducing our Live Debugger, the latest feature that helps make Hightouch the gold standard for integration observability.
Pedram Navid
April 21, 2021
|2 minutes

At Hightouch, we're engineers first. Just like you, we have strong expectations around consistency, reliability, security, and observability. That's why we're so excited about this latest release, the Live Debugger.
When it comes to data, something always finds a way to go wrong. Types might change, duplicates might occur, hidden edge-cases might appear. Having visibility when errors occur is key.
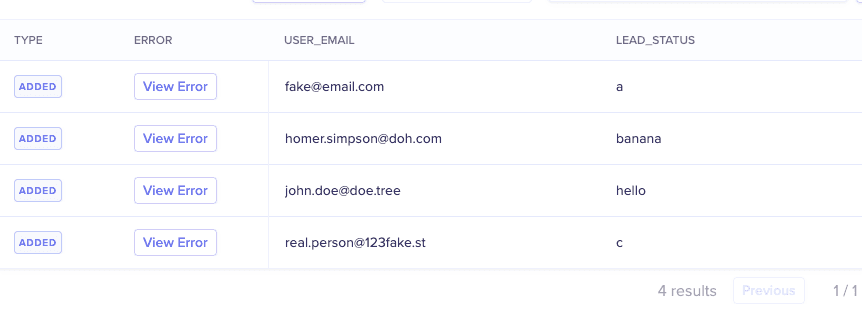
Access the Live Debugger is easy. First, click on any Sync and you'll be presented with a list of Runs. Each Run will list how many records were added, changed, and removed and whether those records were successfully sync'd to the destination or if there was an error.

Click on any Run and you'll get a row-level view of results. You can filter by Successful or Rejected Rows. From there, you can see our Live Debugger by clicking on any row.

Never Wonder Why Your Rows Failed
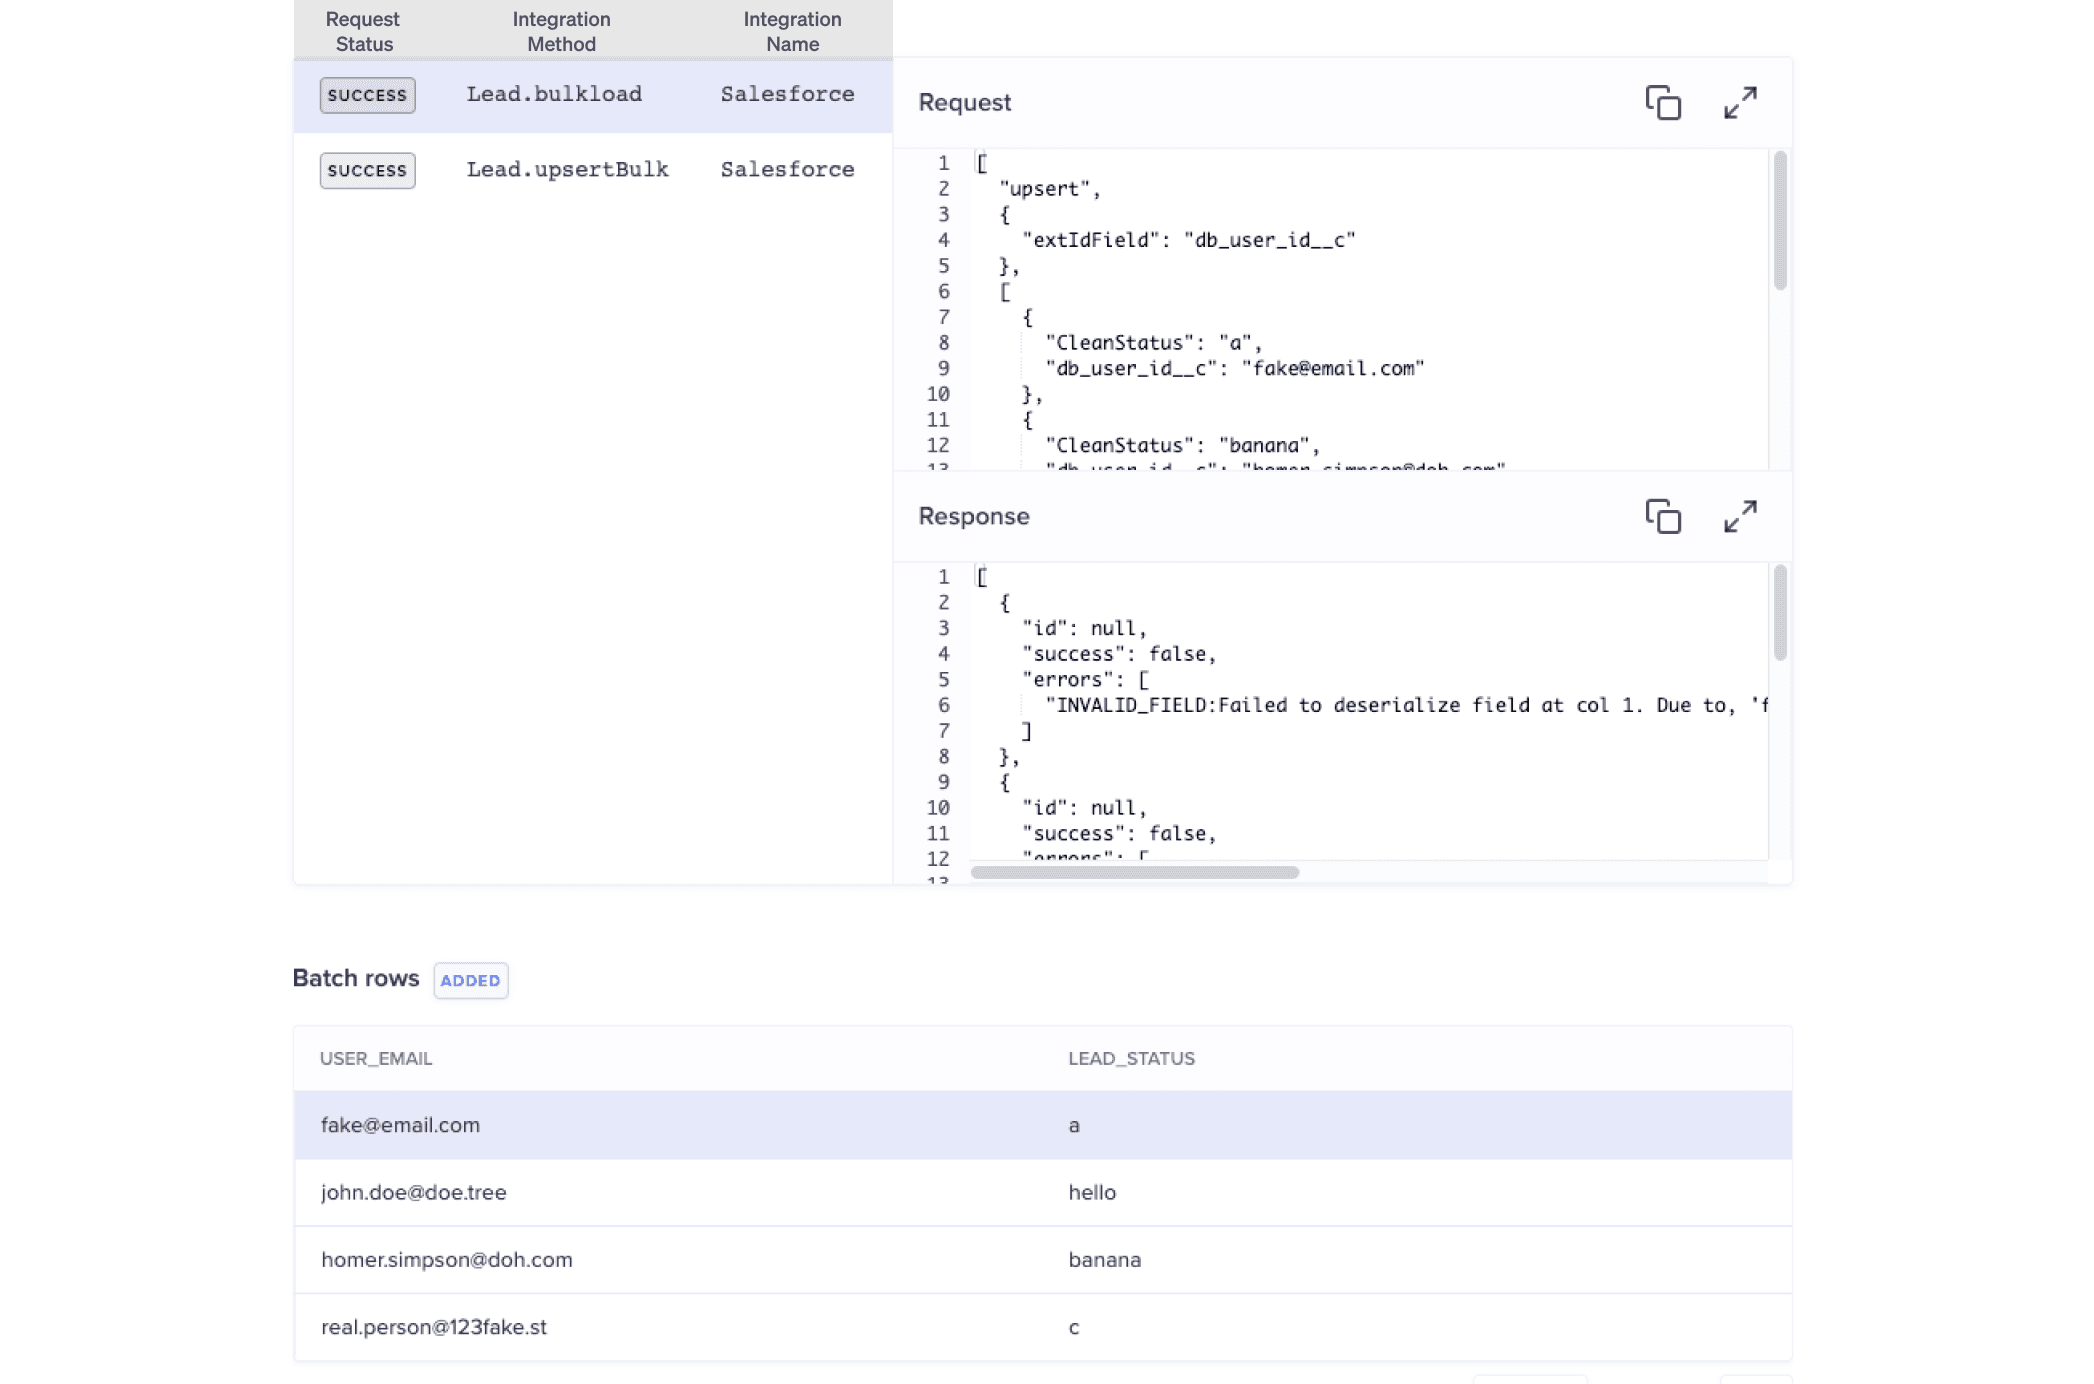
Our Live Debugger lets you see both the request and response on every batch of rows we send to your destinations. Not only can you see what error messages occurred but you can also see every row we sent. You can access the debugger from the Runs page on any Sync.

In this example below, we can see that we attempted a bulk load of data into Salesforce, with details on every column and row. The two requests to the integration were sent successfully, which means the API responded with a success. We can also see the exact request and response set to our integration.

The response contains information on each attempted row in the batch. In our case, the error points to a type-error, and we can see that we're accidentally sending email strings for a user id instead of a double as expected by Salesforce.
{
"id": null,
"success": false,
"errors": [
"INVALID_FIELD:Failed to deserialize field at col 1. Due to,
'fake@email.com' is not valid for the type xsd:double:db_user_id__c --"
]
}
For more information on the Live Debugger and supported destinations, check out our docs. If there's any destination you'd like to see supported let us know and we'll be happy to implement it!


