Automate your external reporting with the Modern Data Stack
With the right infrastructure, reporting can become truly routine. Even more than that, it’s a chance to demonstrate your value to the company and customers.
Pedram Navid
April 27, 2021
|11 minutes

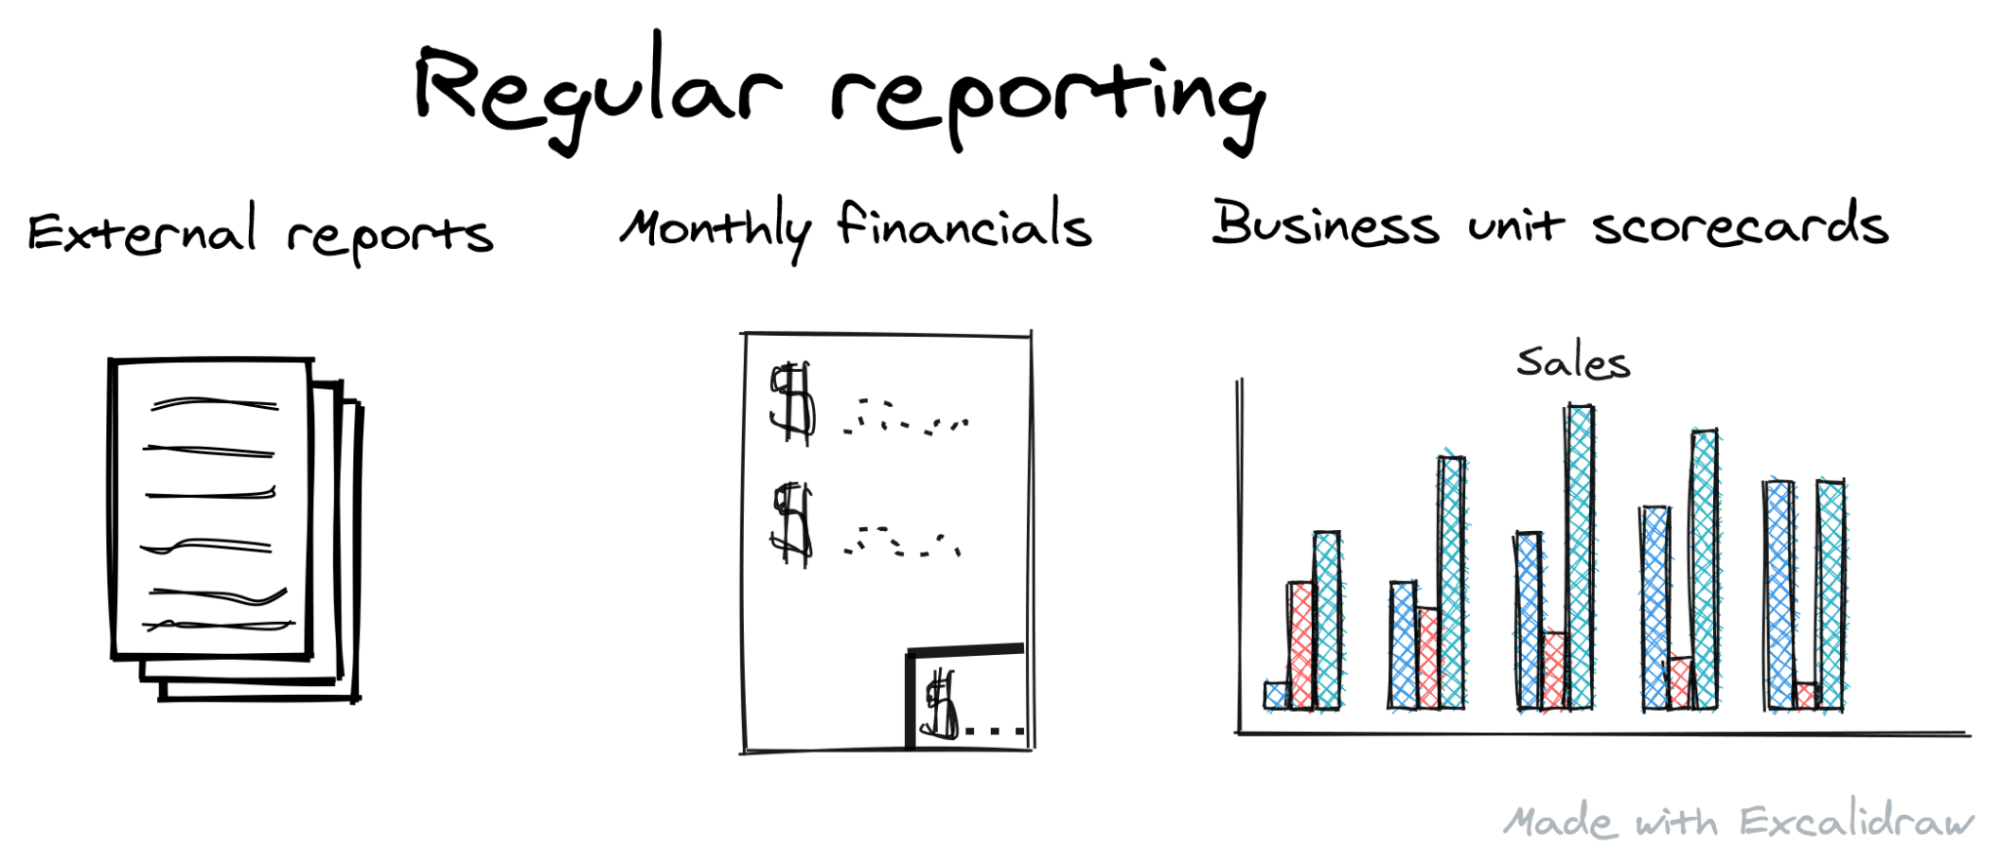
Reporting for major customers or external partners may be the most stressful part of your job as a data analyst.
Picture this: the new month begins, or maybe a new quarter. You’re on the clock — there’s only a week to get your regular reporting out the door. Somehow, though, the process is anything but “regular.” You ask the Sales team for an updated list of big accounts, to customize the database query that IT runs for you. Once you get all the data, it has to be transformed into exactly the format the customer expects, even though these requirements change month-to-month.

In case the stakes aren’t high enough already, your friends from Finance are checking in too. After all, these are the customers that keep your company going!
What makes regular reporting so stressful? For one, as a data analyst, it’s clear to you that this isn’t a good use of resources. While the data function at your company may have been created to meet reporting needs, you’re full of data-driven ideas to serve customers better or improve business outcomes. Rather than wasting time on manual reporting, any analyst would rather spend time… doing analysis!
Reporting is not only less rewarding than other tasks, but comes with major pitfalls, too. As your account manager colleagues remind you, the team needs to keep this big client happy, and they were certainly not happy when the weekly report came late last time. Even after you send the reports on schedules, any inconsistencies your partners spot will make your company look bad, and risks degrading the trust you’ve earned with your colleagues.
Thankfully, your gut instinct is right: reporting doesn’t have to be a drag.
Turning Reporting Into an Opportunity
With the right infrastructure, reporting can become truly routine. Even more than that, it’s a chance to demonstrate your value to the company.
Save Time
Frustrating as it is to spend time manually processing data, reframe it as a chance for a quick win. Say you spend five hours each week on reporting. Once you cut that down to just an hour, won’t it feel great to take credit for “freeing up 10% more time for analytics by automating manual processes”?
Add Value Through Reporting
Besides saving you time, with the flexibility of the modern data stack powering your external reporting, data sharing can actually become a point of pride in your customer relationships. If your client asks for a new product feature, it will probably take several release cycles. On the other hand, if you, the client wants a new data point added to their report, the modern analytics stack lets you cheerfully write back, “Can do! I’ll have that ready for next month.”
Improved data-sharing services will also create new revenue opportunities. Existing clients may pay extra for additional data or more frequent updates. Additionally, prospective customers realize that data has serious monetary and social value, and flexible data sharing can be your sales team’s secret weapon.
Finally, as a core data team function, top-notch reporting rallies stakeholder support for investing in data infrastructure or giving analysts a seat at the strategy table. While the CFO might sign off on a better data loading platform to meet reporting needs, faster ELT will make analytics and data science projects more feasible, too. As you spend less time preparing datasets and more time analyzing them, you can hook colleagues with your insightful suggestions.
By tapping into tools that centralize and manage your data in a centralized data warehouse, you can make reporting seamless and even more powerful.
How to Modernize Your Reporting
Though the technical and organizational challenges may seem daunting, you can update your reporting workflow — step-by-step, taking on one problem at a time.
We’ll walk through the key pain points, from beginning to end, and lay out what it would mean to automate these steps. We’ll also suggest frameworks and tools to put this automation in reach.
Assembling Data
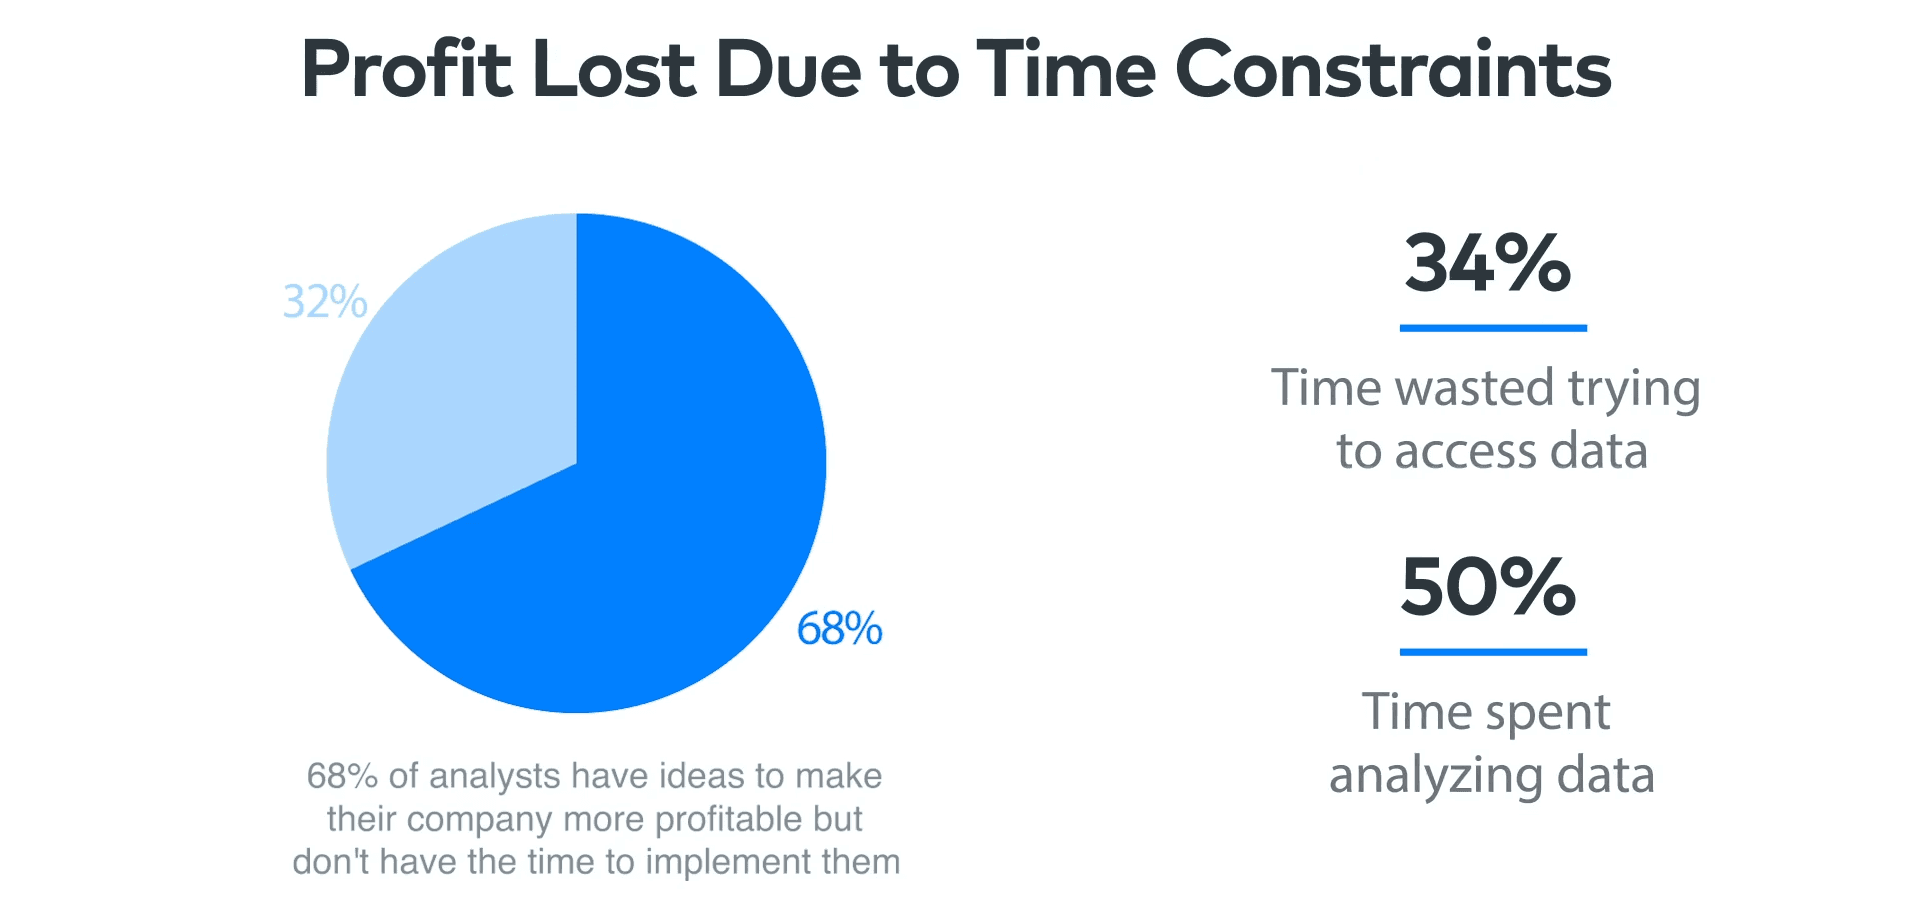
A 2020 surveyof hundreds of data professionals around the world found that analysts spend one-third of their time just trying to get data.

Are you waiting on colleagues to send that spreadsheet you asked for days ago? Or maybe you have access to other teams’ systems — but have to log in and pull reports from five different places?
Wouldn’t it be great if all of your raw data just showed up in one place? Even better, if you were sure that it’s consistent and up-to-date?
ELT: Extract, Load, and Transform
To solve the problem of data access, many companies have turned to an approach called ELT. In comparison with the traditional ETL model, ELT says: first make a copy of raw data from key sources in a centralized warehouse, and then clean, join, and reshape that data into reports, dashboards, and other analytics outputs.
‘E’ and ‘L’ — extracting from source systems and loading into your warehouse — typically happens in batches, on a regular schedule. Every 6 hours, for example, your pipeline identifies all the new records in your sources, or records with changes, and updates the warehouse.
Robust extract-and-load pipelines also respond to changes in the data source without breaking, and generate clear logs so you can investigate problems that need human intervention.
Build vs. Buy
Once you decide to scrap manual, error-prone data collection routines for automated, trustworthy data replication pipelines, make a list of all of the data sources your reporting relies on. Double-check with the business units you collaborate with. When they send you Excel files, where are they getting those files from? Sources will probably fall into a few categories:
• SaaS platforms that your sales, marketing, or customer service teams rely on, like Salesforce, Hubspot, or Zendesk.
• Databases (like Postgres or MySQL) or APIs that power your company’s products and services. These are probably maintained by the development team.
• File systems, including external FTPs or cloud storage like Amazon S3.
To truly free yourself from hunting for data, you’ll want automatic pipelines for all of these important sources. Plus those pipelines need to work reliably, or else you’ll still be wasting time monitoring and maintaining them.
If you don’t have the time or technical expertise to develop your own data loading pipelines, there are multiple vendors with out-of-the-box solutions. These tools have done the hard work for you — they come with pre-built integrations to common data sources and warehouses, using best practices for batch data loading. Instead of writing customized code, you just connect your warehouse, pick the sources you need to pull from, and hit go.
Automatic data loading is getting a lot of attention, but right now some great options to check out include Fivetran, Stitch, Matillion, Xplenty, Meltano, and Airbyte.
Data Cleaning
Once you have all the data you need, the rest is easy, right? All you need to do is follow these 12 steps to pull all your sources together in Excel. Or, maybe, there’s a script one of your colleagues wrote, and you just change the file paths and hit “run”.
Works great — until engineering drops an important database field without notice. Even worse, it may look like your data manipulation in Excel went just fine, before a client complains about missing data and you realized that your copy-paste left out several months!
Proponents of the modern data stack believe that data prep can be made stress-free, by centralizing transformation in the data warehouse and adopting best practices from software engineering.
SQL Models for Data Prep
Under the ELT model, data transformation — the ‘T’ in ELT — are typically written in SQL, and run directly in your data warehouse. SQL is a great language to collaborate in because it is widely known by business and analysts as well as data and software engineers. It also translates without much difficulty from one database to another, so if your team decided to switch from a Postgres warehouse to BigQuery, for instance, it wouldn’t be difficult to update your models.
How you should approach data modeling itself is a huge topic. For reporting purposes, however, you can get started with a two-step process:
- Create “staging” models for each of your source tables, where you clean the raw data: ensure column names are consistent, replace empty values with NULL, etc.
- Join these staging models to create the files you need for reporting.
Best Practices for Reliable Reporting
dbt, a popular tool for in-warehouse transformations, not only manages your SQL models, but also automates all provided infrastructure for building a reliable software project. For reporting purposes, these include tasks like creating documentation and testing data quality.
Document Your Data Models
To supplement data that you report externally, your partners will also need a data catalog, explaining what it is you’re sharing. If you’re on vacation and a customer asks your teammates what a particular attribute means, they’ll also be grateful to you for writing documentation that gives a quick answer.

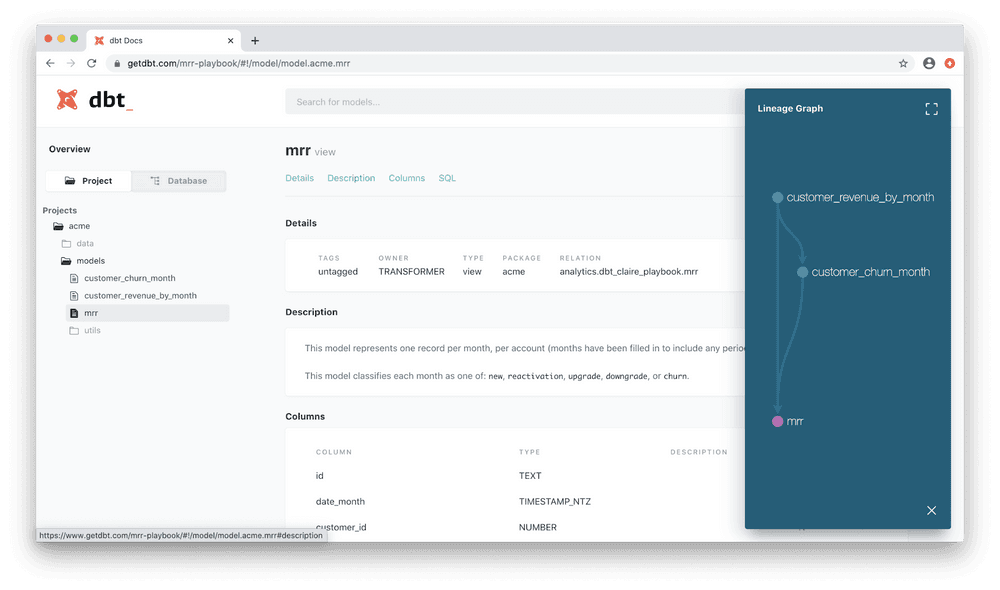
dbt makes it easy to add documentation as you’re building models, and automatically creates a documentation website that lists out all of the fields in those models. Right out of the box, you can share that list of columns as a data catalog for your partners.
Test, Don’t Stress
To avoid embarrassing data quality errors and easily diagnose broken joins or missing data, dbt lets you define tests on schemas (for example, make sure foreign keys are valid) and data (verify that last_active_date >= account_created_date).
By running tests every time your model builds, you can be confident that data quality issues won’t make it into the reports you share. If you have contractual commitments about reporting uptime or how each column needs to be formatted, testing can keep you safely in compliance.
Version Control: Saving Your Work
All of the work you do in dbt, whether writing a data model or configuring tests and documentation, is part of a single “project.” The whole project is easy to put under version control, so you’ll never lose your work, and multiple people can collaborate on building a project at the same time.
Data Sharing: The Final Mile
Once the E, L, and T are finally done, it’s time to get the report to your customers. Emailing a flat file takes time and is error prone: you might attach the wrong file or forget to CC an important stakeholder. Besides, I always feel conflicted sending customer info through such an open system.
Additionally, as your company grows, you’ll have more and more reports to share each quarter. To scale your reporting, here are a few suggestions for how this final step in the process can be automated away.
Share Resources From Your Data Warehouse
Many cloud data warehouses, such as Snowflake or BigQuery, allow you to grant external users read-only access to particular tables or datasets. Besides freeing you from needing to “deliver” any data to an external system, your partners always know where to find the most recent version of your report.
Dashboards
You might already be using a tool like Looker, Metabase or Data Studio for internal business intelligence. These platforms all support sharing data with people outside of your organization. You can provide partners with a link to click on, or set up automatic email delivery of particular slides. And just like sharing data from the warehouse, your customers can be sure that they are looking at the most up-to-date data.
Sync With Key Business Systems
What if your reporting moved directly into your customers’ business systems? Hightouch lets you sync data from your warehouse to any SaaS tool. No custom engineering required — everything is SQL based, so you can reuse the data transformations you’re already doing.
With Hightouch, shared data will always be up-to-date; unlike the warehouse and dashboard approach, your customers will never need to access your systems for an update. Everyone will be on the same page, because they’ll always be looking at the exact same data.
To see how Hightouch’s approach to operational analytics can power your reporting, set up a demo with a data expert.


