A marketer's guide to attribution modeling
Learn everything there is to know about attribution modeling and how you can build your own custom attribution model tailored to your business.
John Lopus,
Luke Kline
May 22, 2023
|18 minutes

After spending almost ten years in the data and martech space–including at the leading mobile attribution company, I can safely say that the hardest challenge marketers face is trying to identify “when,” “where,” and “what” causes prospective leads to convert to paying customers.
Every company wants to optimize their marketing campaigns and increase ROI across channels. However, very few companies see this dream into reality due to the complex nature of attribution modeling.
This blog post will explain attribution modeling, the various types of attribution models, and also show how you can build your own custom attribution model
What is Attribution Modeling?
Attribution modeling is the process of assigning credit or a percent value to specific touchpoints across your marketing channels so you can identify which campaigns contributed to a user’s conversion.
Using a core set of rules that you define, attribution modeling helps you determine how much credit to attribute to various touchpoints across the customer journey so you can optimize your marketing spend towards channels that are more likely to convert.
How to Create an Attribution Model
Building an effective attribution model only takes three steps:
1. Collect data from all of your sources
Attribution modeling starts at the data collection level, where you aggregate data across all of your touchpoints. You can collect data on website and app user visits using tracking tags or UTM parameters. By embedding these parameters within specific URLs, you can track which individual channel, campaign, or test variant drove a user to your website and what they did after they arrived.
UTM parameters you can leverage include:
- utm_source: This tag identifies the source of the direct traffic, such as Google, Facebook, or email.
- utm_medium: This tag identifies the marketing medium, such as CPC (cost per click), email, or display.
- utm_campaign: This tag identifies the specific campaign, such as a product launch or a seasonal sale.
- utm_content: This tag identifies the specific ad or content the user clicked on, such as a banner ad or call-to-action.
- utm_term: This tag tracks specific keywords used in a campaign, such as in a paid search campaign.
Understanding what brought users to your website is only one side of data collection; you also need to collect engagement data on your website or app. Event collection platforms like Snowplow offer code snippets or software deployment kits (SDKs) you can install on your website/app to track behavioral data on your users. This data often includes conversion events like pageview, add to cart, signup, product views, page time, purchase completion, etc.
2. Combine and Centralize Your Data
Once you’ve collected data on which channels and campaigns are driving traffic and are successfully tracking user behavior and conversions, it’s time to start preparing this data for attribution modeling.
To combine all of your data, you will need to ingest all of the data from Step 1 into a data warehouse. The simplest way to do this is by using an ELT solution like Fivetran. This will help automate this process and save developer time and resources. Once your data is centralized in a Data Warehouse, you’re ready to start modeling your data.
3. Choose an Attribution Window
There are multiple types of attribution models, but before selecting a model type, you need to decide on an attribution window. An attribution window is the defined period of time between a user engagement and a conversion during which you believe it’s appropriate to assign credit to the engagement.
For example, at a B2C e-commerce company, you may want to set a 30-day attribution window where if a user clicked on a paid ad and then converted within 30 days, you would assume the paid ad was at least a partial driver of the conversion. Conversely, for a B2B enterprise software company, you may set an attribution window of 12 months because the sales cycle is much longer. Your attribution window will vary greatly based on your industry, product, and sales cycle.
Types of Attribution Models
With attribution modeling, there is no one best model type for every business. Every business is different and has different customer behavior. Also, different attribution model types can teach you different things and provide unique insights.
You will need to choose a model that will help answer the question you are trying to answer. For most businesses, it is helpful to look at multiple attribution models to get a full picture of the customer journey and the overall path to conversion.
While you could technically create an unlimited number of attribution models in your business, there are a few common attribution models that companies rely on to perform measurement across channels.
First-Touch Attribution
First-click attribution (also known as single-touch attribution) is a modeling method that helps you identify which digital marketing channels are most successful in driving initial awareness and engagement with your customers. This modeling method ignores all other touchpoints in your customer journey and instead awards 100% of conversion credit to the initial interaction a customer has had with your brand or product.
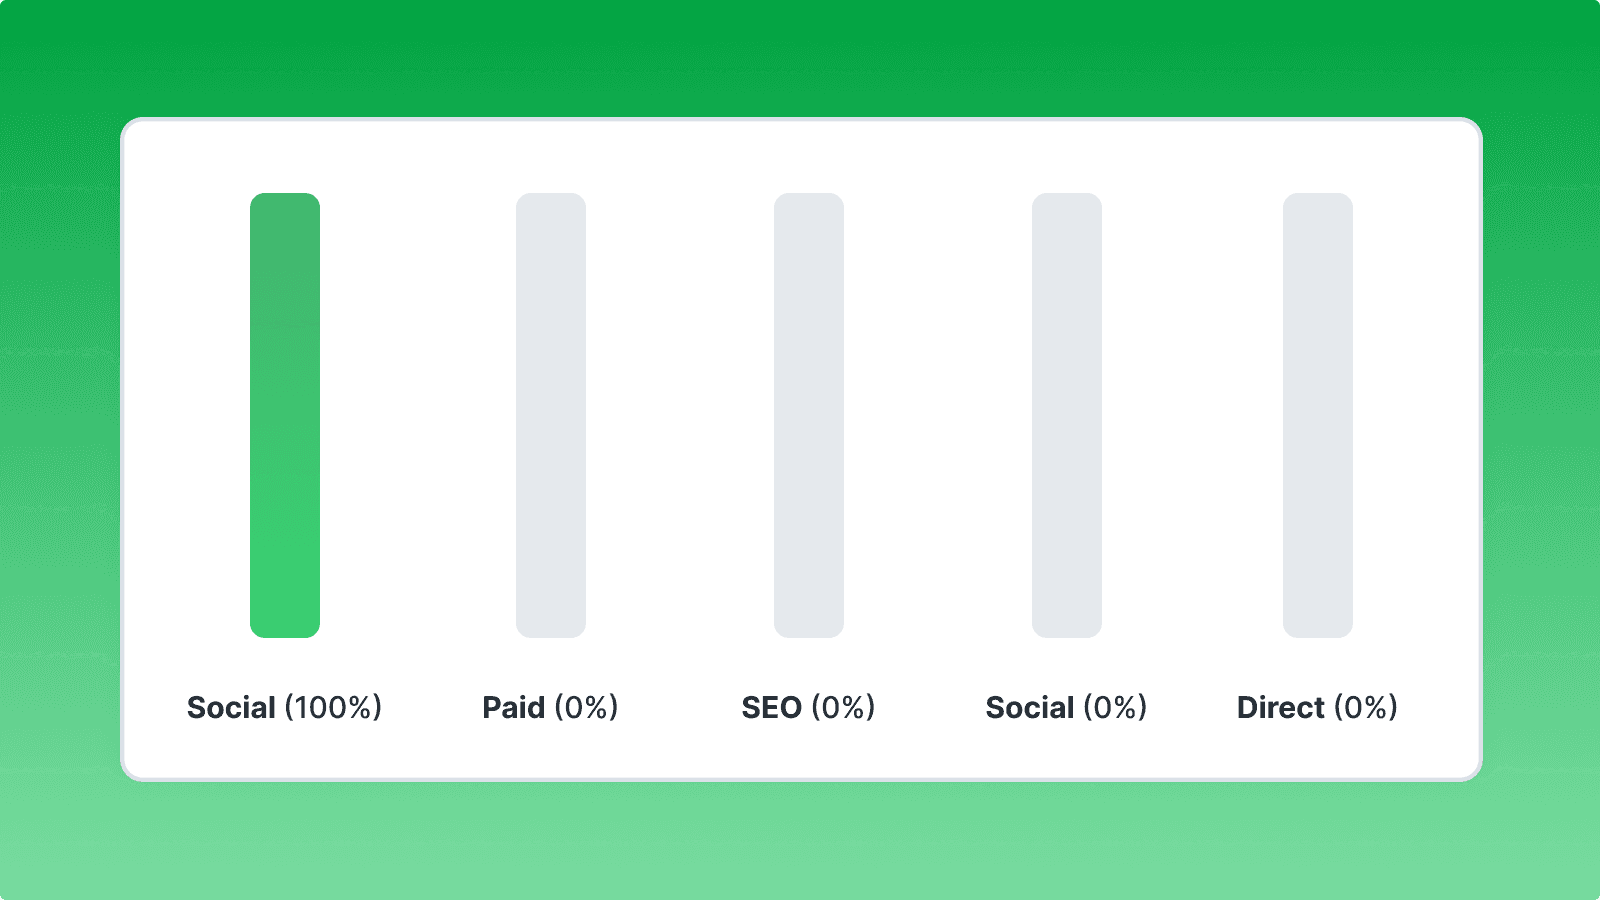
Example:
- You launch a new product and run a social media campaign to promote it.
- User A clicks on an ad and visits your website but doesn’t make a purchase.
- Later on, that same user sees a Google search ad and makes a purchase.
Under a first-touch attribution model, you would award all credit for customer conversion to your social media ad as the driving force purchase or the conversion action.
Last-Touch Attribution
Last-click attribution is the exact opposite of first-touch. With this modeling method, all credit is awarded to the final interaction a user has with your brand. Companies tend to use this modeling method when they want to identify which marketing channels are most impactful in the final stages of the customer journey.
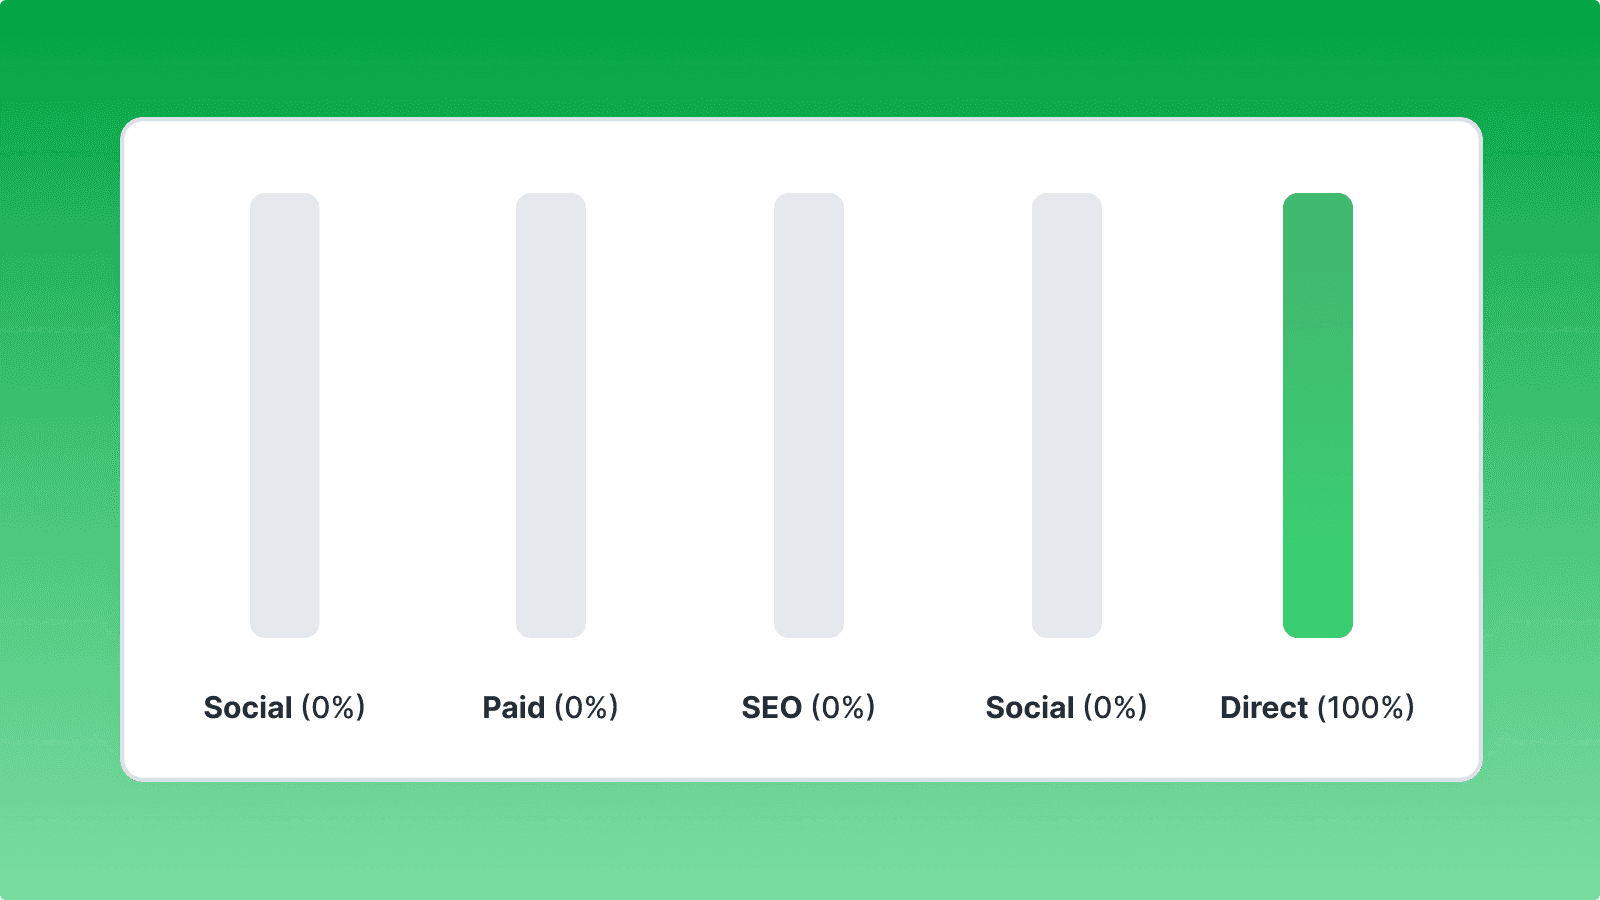
Example:
- User A sees multiple ads for your company across Facebook, Google, Twitter, TikTok, etc.
- User A user visits your website and views multiple products but never ends up purchasing.
- You send a promotional email offering a special discount encouraging the user to purchase.
With last-touch attribution, your promotional email would be credited for driving the sale.
Linear Attribution
Linear attribution (also known as fractional attribution) focuses on distributing equal credit across all of your marketing channels. This modeling technique doesn’t emphasize any particular tactic. It’s more focused on creating a complete view of your customer journey and conversion path so you can understand exactly how you’re targeting specific audiences. However, linear attribution doesn’t provide any insight into how effective specific channels are at driving conversions.
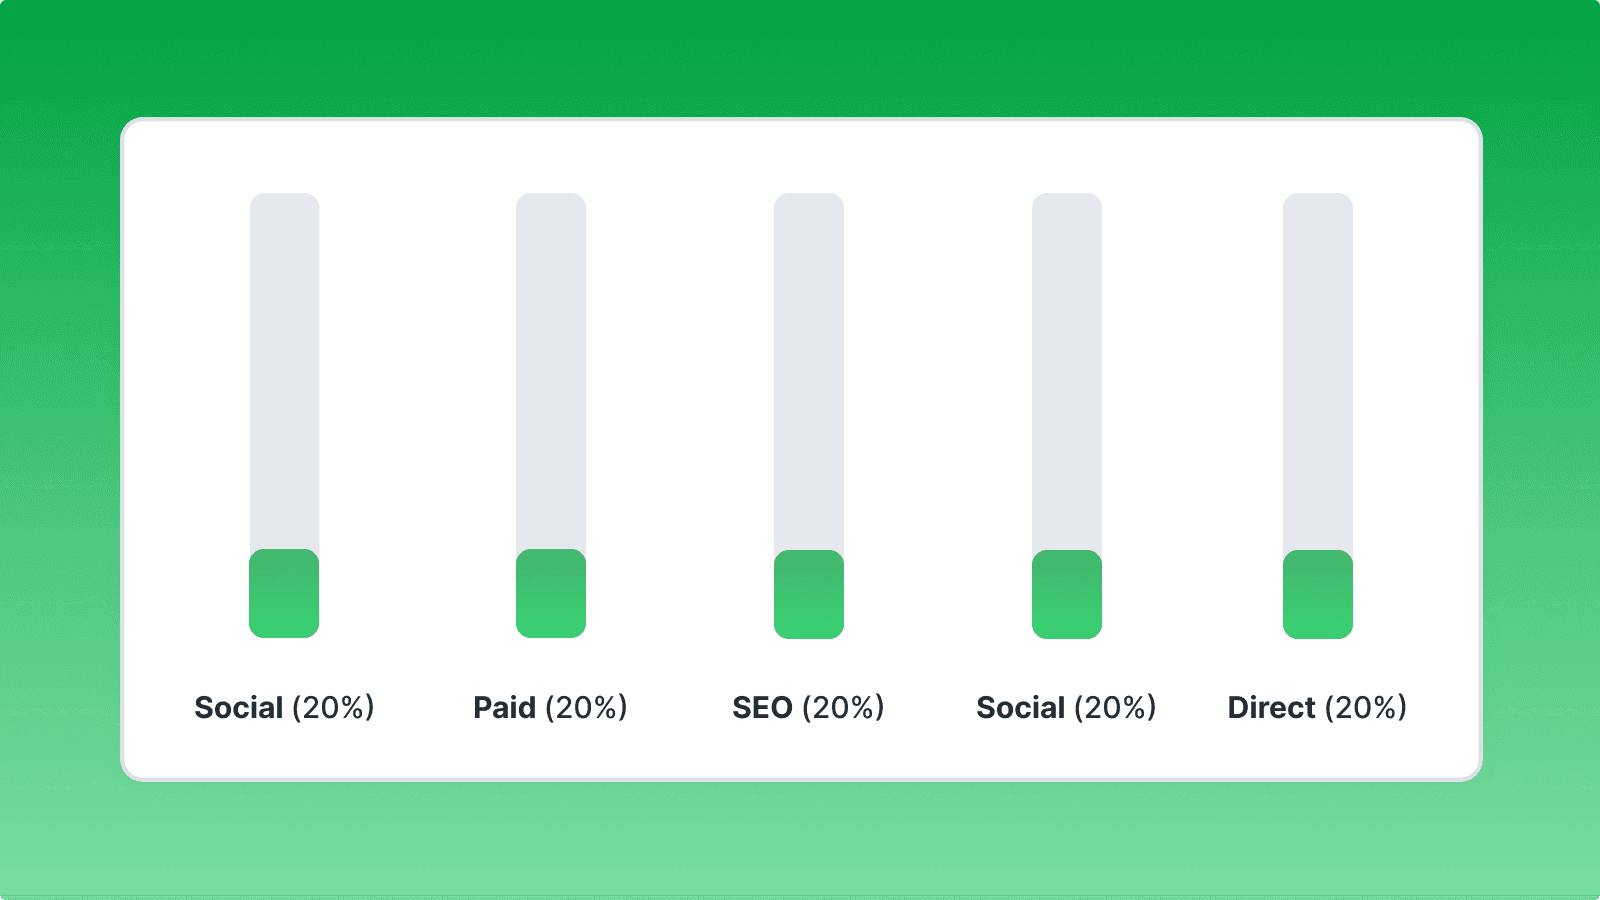
Example:
- User A sees an ad for running shoes on TV
- User A does an organic search for “best” running shoes
- User A sees a Google Ad for Nike Trainers
- User A visits the nearest store and makes a purchase
Under a linear attribution model, each customer interaction is credited equally for driving the sale.
Time-Decay Attribution
Time-decay attribution is a modeling technique that assigns more credit to interactions that take place closer to the time of conversion. This modeling method places a high emphasis on bottom-of-funnel touchpoints, but it doesn’t completely discard upper/mid-funnel tactics in the same way that last-touch attribution does. It’s especially helpful when you have longer sales cycles (e.g., taking out a mortgage on a house). With time-decay attribution, you can understand your entire customer journey and see exactly which channels are most likely to push a customer over the finish line.
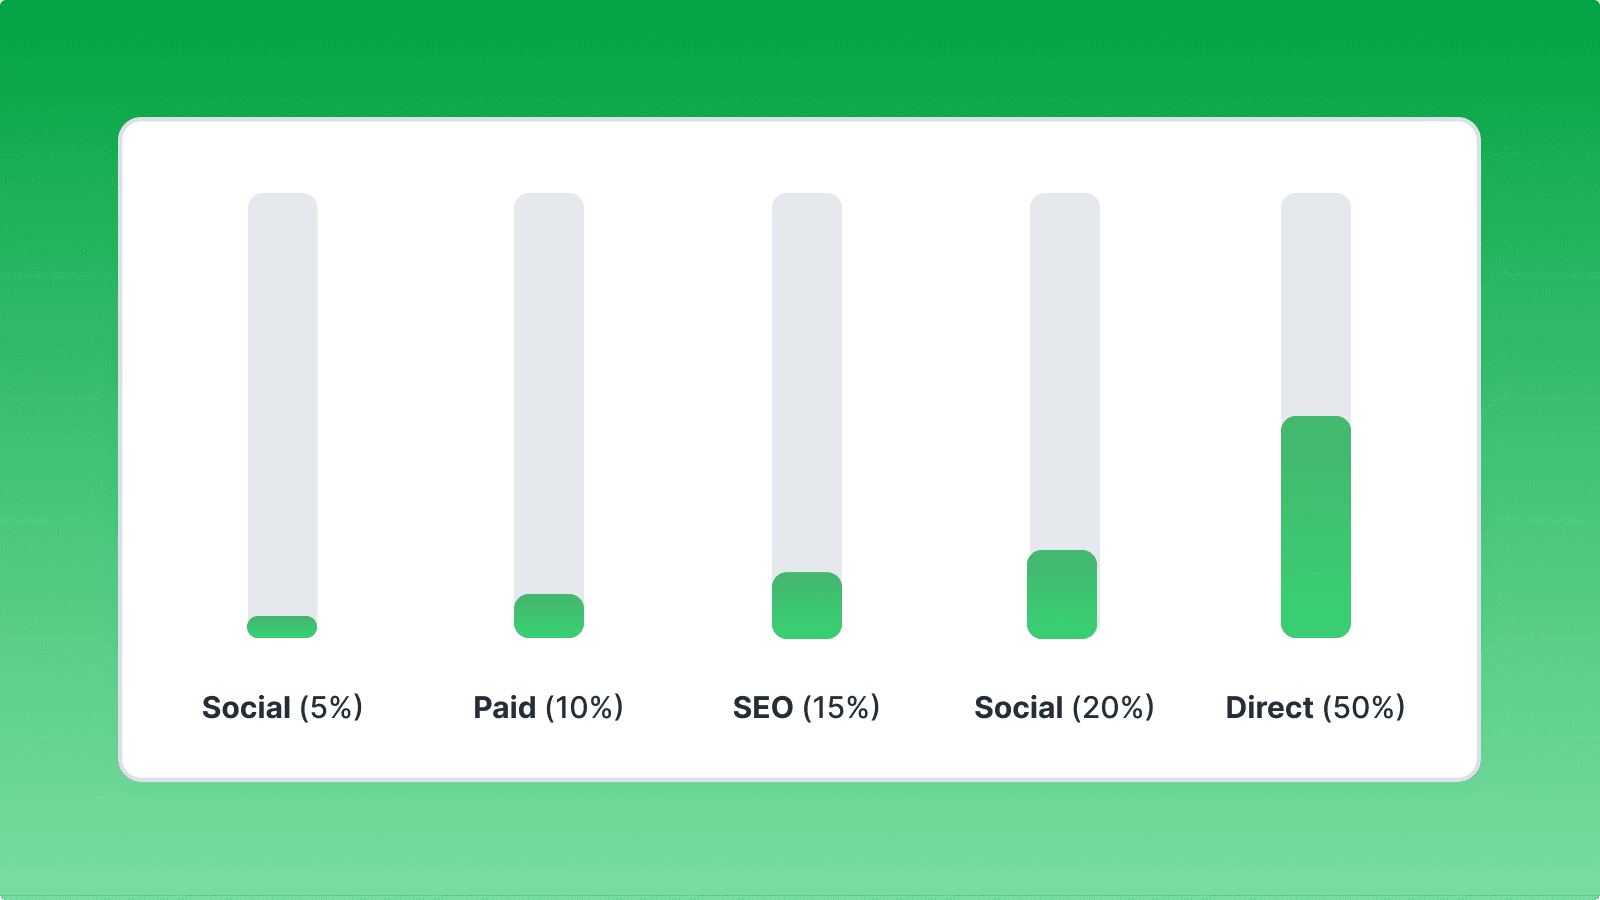
Example:
- User A does a Google search on mortgage brokers
- User A reads a blog post about mortgages
- User A searches for similar competitors
- User A schedules a call to discuss options 30 days later
With time-decay attribution, you credit all of your marketing channels, but you apply a heavier emphasis to the final interaction that caused the conversion.
U-Shaped Attribution
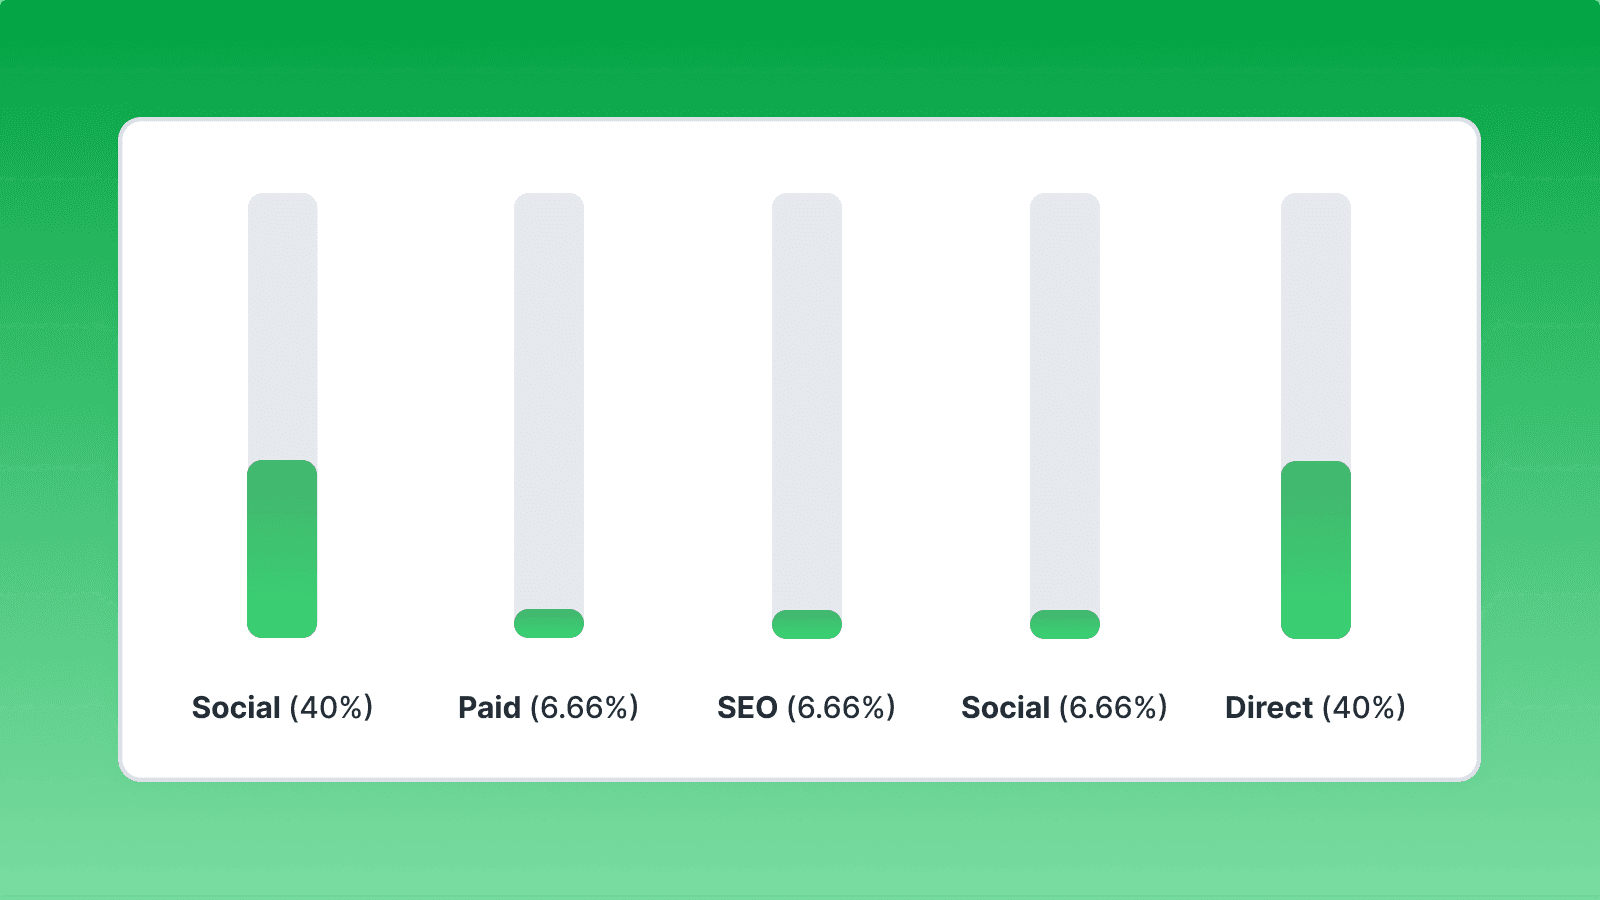
U-shaped modeling or position-based attribution focuses solely on top-of-funnel and bottom-of-funnel efforts. With U-shaped attribution, award conversion credit to the first and last touchpoints that led to a conversion. U-shaped attribution helps identify exactly which channels drive awareness and which channels drive conversion. This attribution model assigns 40% of credit to the first touchpoint, 40% to the last touchpoint, and the remaining 20% to all touchpoints in between.
Example:
- User A reads a blog post after doing a Google Search
- User A clicks on signs up for an upcoming webinar
- User A visits your product page
- User A signs up for a free trial
- User A schedules a demo
With U-shaped attribution, 40% of credit goes to the blog post, 40% to the demo, and the remaining 20% across all other interactions.
W-Shaped Attribution
W-shaped attribution casts a wider net when it comes to crediting conversion channels. Companies tend to rely on this model when they have multiple touchpoints and complex omnichannel campaigns running. The advantage of this approach is that it allows you to holistically look at your top, middle, and bottom-of-funnel efforts.
Example:
- User A clicks on a Linkedin Ad.
- User A fills out a lead form to download a whitepaper
- User A signs up for a free trial
- User A schedules a demo
- User A purchases a paid version of your product
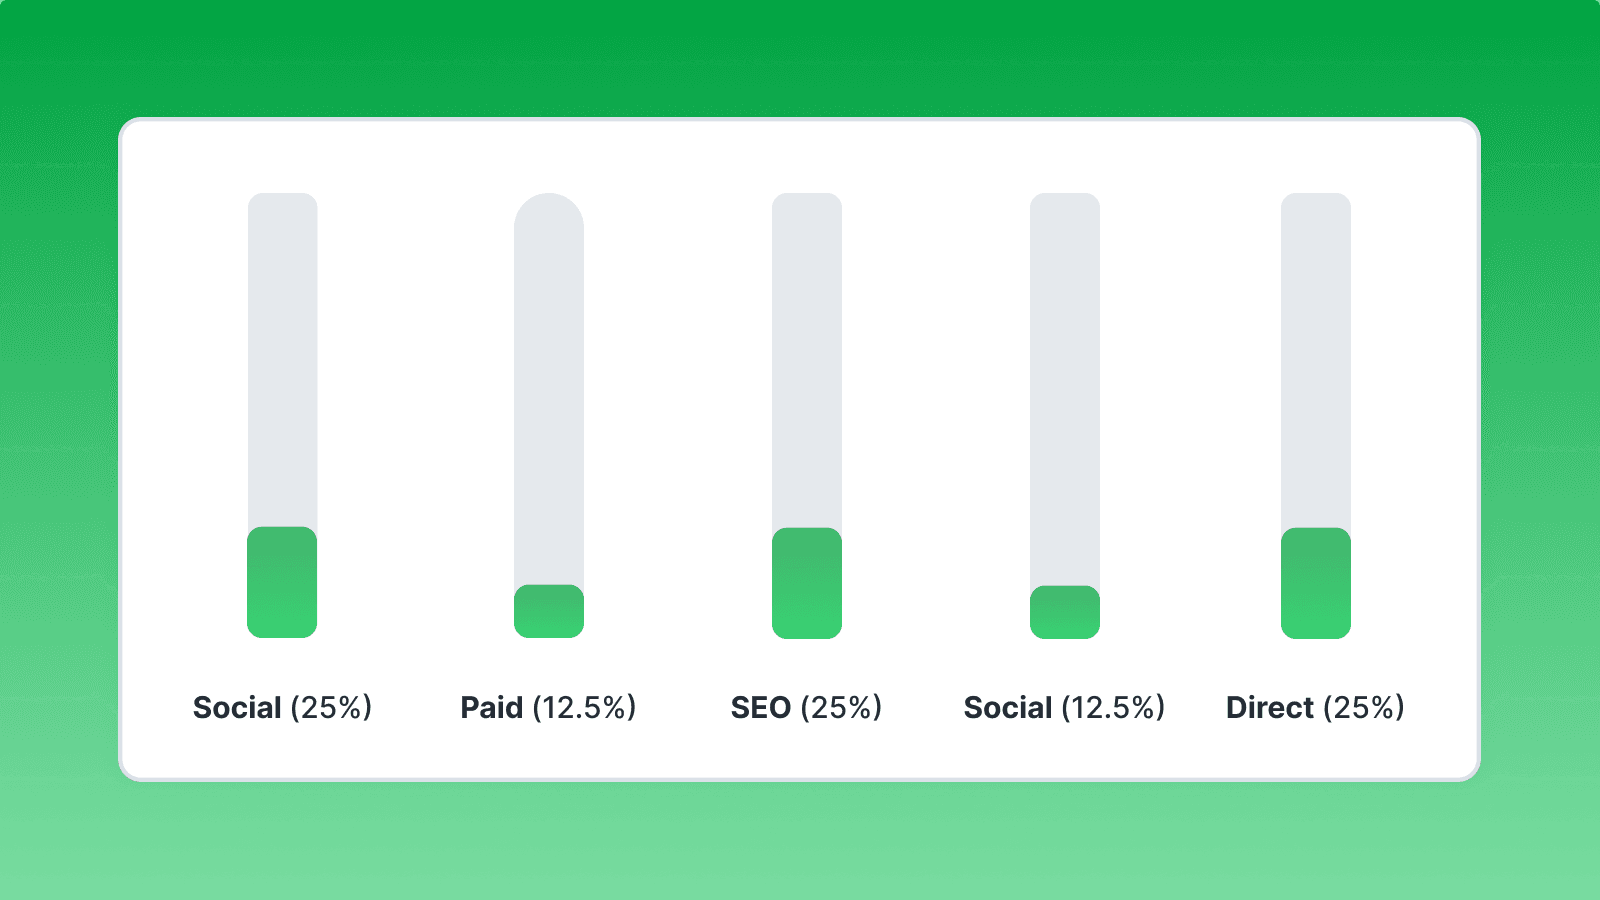
With W-shaped attribution, 25% of conversion credit goes to the initial Linkedin Ad click, 25% to the signup, another 25% to the demo, and the remaining 25% is distributed between the other touchpoints.
Custom Multi-Touch Attribution
Multi-touch attribution is the most comprehensive and accurate scale when it comes to measuring the impact that your marketing channels have on your conversion rates. With multi-touch modeling, you credit specific marketing channels based on your own unique organizational insight. This modeling method is slightly more complex because rather than applying cookie-cutter averages to various channels, the focus is on crediting each channel based on its impact.
Example:
- User A searches for “home insurance”
- User A clicks on a search ad for this term
- User A fills out a quote form after reading your blog post
- User A receives an insurance quote
- User A receives a promotional email with a special discount code
- User A creates an account
- 30 days later, User A purchases an insurance plan from you
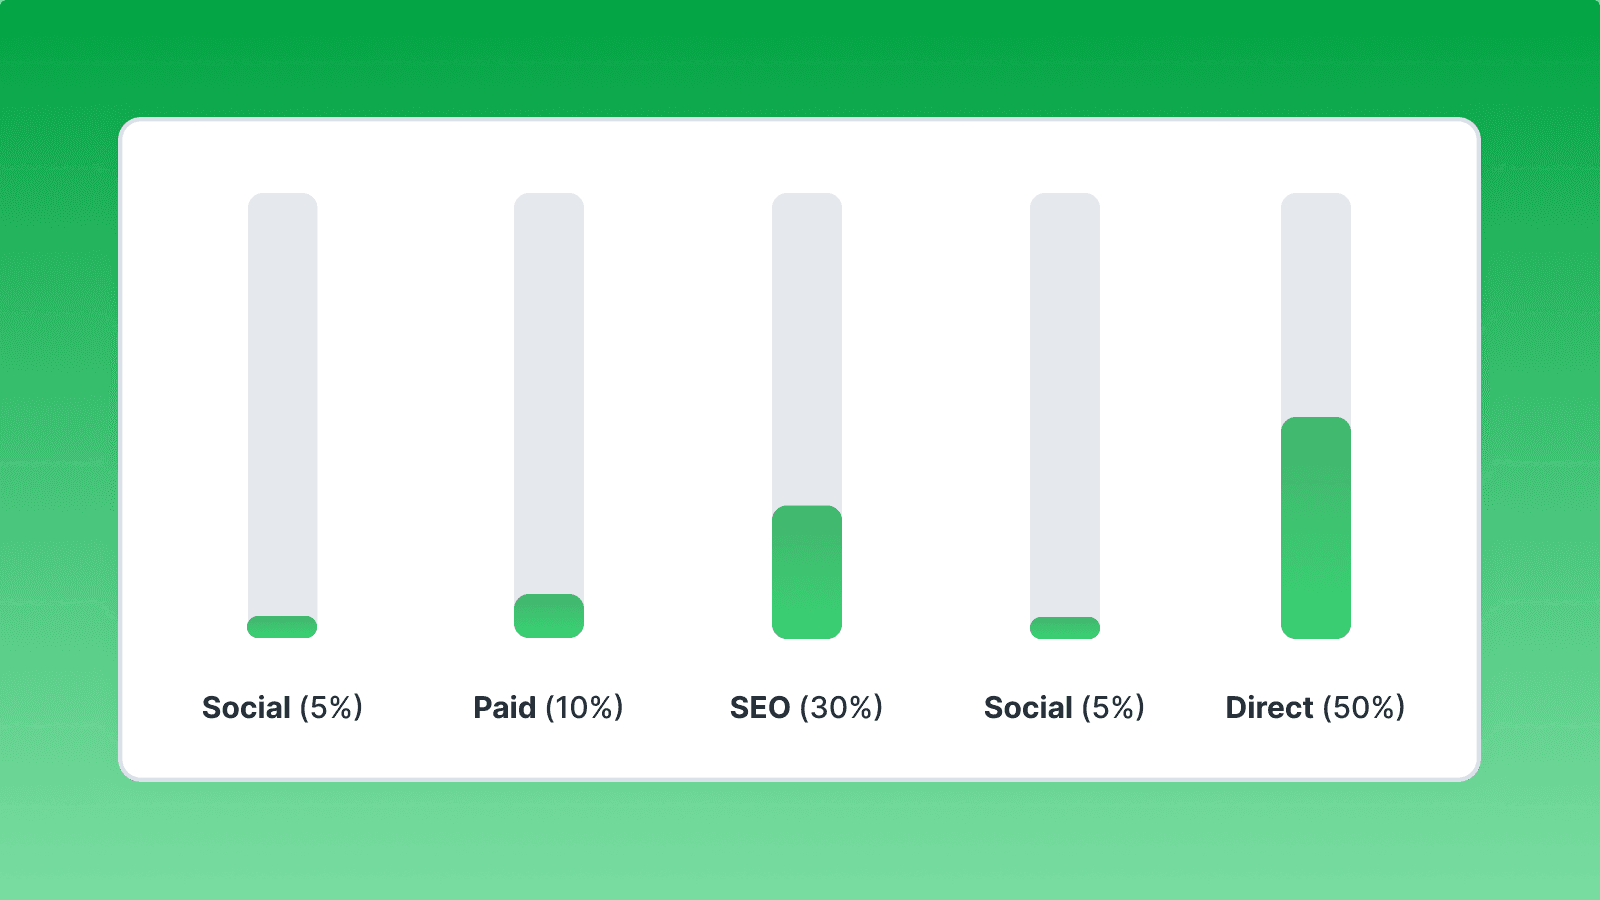
This form of data-driven attribution tends to be the most accurate because it relies heavily on your business understanding rather than a generic prebuilt model. For example, if you know that users who open your promotion emails are twice as likely to become paying customers, this is likely the most important touchpoint in your conversion funnel. In order to perform custom modeling, you need first to have a detailed understanding of every stage in your customer journey.
Why is Attribution Modeling So Hard?
Every company does attribution modeling, but very few companies do it well. Organizations spend billions of dollars on marketing campaigns every single year. If this weren’t the case, there wouldn’t be a billion-dollar industry built entirely around attribution modeling.
Correlation Doesn’t Equal Causation
What makes attribution modeling so hard is that it’s impossible ever to be entirely accurate. Attribution modeling can only give you indicators of why a customer may have purchased, but it can never provide you with 100% certainty that a specific action or channel led to a conversion. The only way to understand what led to conversion is to ask the customer directly–and even this methodology is flawed because, in many cases, the customer doesn’t even know.
The biggest misconception in attribution modeling is assuming someone converted because they were in your existing ad audience. Just because someone from your Facebook audience converted doesn’t actually mean they ever saw an ad or interacted with it. The problem is ad platforms still count this as a conversion as long as a user is in the audience you’re targeting, so you can never be entirely sure of the correlation.
Marketing Funnels are Complicated
Depending on your business model and industry, the length of your marketing funnel varies substantially. For example, an e-commerce B2C website like Amazon might have a very short conversion funnel, where a user purchases immediately after seeing an ad. Conversely, a company like realtor.com has a nonlinear customer journey and a super lengthy sales cycle because it can take months for someone to purchase a home. It’s very difficult to understand the interplay between touchpoints because there are so many involved parties in the real estate industry (e.g., buyers, sellers, brokers, lenders, listing sites, etc.) that can all play an impact.
Pre-Built Models Have Limitations
Ad platforms like Google Analytics, Facebook, Instagram, Tiktok, etc., all have their own default attribution models you can use (e.g., first-touch, last-touch, time-decay, etc.) These models are designed to credit themselves, and they’re not designed to support cross-channel analysis, which means you have no idea if someone interacted with your Facebook Ad before interacting with your Snapchat ad and purchasing.
While attribution-specific platforms offer more flexibility compared to ad platforms, even these present their own limitations because they rely on predefined rules and rigid models to assign credit to specific touchpoints. Additionally, these platforms create a disconnect between your marketing tools because they don’t easily integrate into your current technology stack, and getting data into these platforms presents its own unique set of challenges.
You Can’t Leverage First-Party Data
Off-the-shelf attribution tools present additional challenges when it comes to modeling because they don’t allow you to leverage your existing first-party insights. Most attribution modeling is limited specifically to marketing channels, but in reality, customers have many more touchpoints with your brands that can help you optimize your channel performance, whether it’s sales interactions, support tickets, or even additional peripheral data about a specific user. With traditional attribution, you’re limited solely to your campaign data, and it’s very difficult to account for any additional first-party data (e.g., industry, recent purchases, LTV, etc.)
Why You Should Use SQL Attribution Modeling
While off-the-shelf tools can certainly be an appealing option to tackle your attribution use cases, these platforms are very inflexible, expensive, and surprisingly complicated to use. They act as black boxes, giving you little to no control over how your data is actually modeled. Marketing attribution platforms simply aren’t built to handle multi-touch attribution models. On the other hand, SQL presents several benefits from a modeling standpoint:
- More flexibility: Traditional attribution platforms offer limited cookie-cutter models. They’re not built to handle custom-multi touch attribution. SQL offers greater flexibility because you can transform your data in the way that best suits your business.
- Greater transparency: Writing your own SQL logic enables you to see how credit is assigned to each individual touchpoint in your marketing and sales funnel. You have complete visibility into the logic behind each of your models so you can understand the underlying rules.
- More scalability: Building your own attribution models in SQL is much easier to maintain and scale because you have granular control over your attribution rules, and you can easily modify or change them for your use cases as needed.
- Lower costs: Attribution platforms usually charge based on conversions or attributions. Building SQL models inside your existing data warehouse completely eliminates this redundancy.
- Access to more data: Your data warehouse has access to any and all of your data–not just campaign-level conversions. With SQL, you can merge any and all of your datasets together to build more accurate and cohesive conversion journeys.
How to Build a Custom Attribution Model
In my experience, the number one reason that organizations choose off-the-shelf attribution platforms is that they simply don’t understand their existing data. The truth is most companies already have all of the data they need to do this type of modeling in their data warehouse; they just don’t know how to use it – and writing SQL to build custom models seems more complicated than it actually is.
Here are the steps to build an attribution model in SQL.
- Join touchpoint and conversions data: Gather all of your data for marketing and touchpoints, and conversions. A simple way to do this is to create two Common Table Expressions (CTEs) — one for touchpoints and one for conversions. If you have other data sources, like offline events, you can create additional CTEs. Once you’ve created these tables, join them to a single view.
- Find all touchpoints before the conversion: After you’ve joined your touchpoint and conversion data, you need to identify all touchpoints that occurred before the conversion event. You can do this in your
joinstatement or in the ‘’’where’’’ clause using a comparison function liket.touchpoint_time < c.conversion_time. - Add a session index value to your table: Next, you want to assign the index number to each touchpoint. For example, the first touchpoint would be “1”, the second touchpoint would be “2” and so on. To do this use the
ROW_NUMBER() OVER (PARTITION BY customer_id, touchpoint_id)function. - Allocate attribution weights: Now that you have all of your touchpoints labeled in order and tied to conversions, you need to assign weights. These weights are your rules on how much credit you want to give to different touchpoints. The simplest way to do this is to use a
CASE WHENstatement in a new table. For example:CASE touchpoint_index When 1 then 0.7 When 2 then 0.2 When 3 then 0.1 Else 0 END as attribution weight
After completing these four steps, you now have a table of touchpoints for each user and what percent of each conversion the touchpoint was responsible for. This allows you to create a summary by channel, campaign, page URL, or any other touchpoint data point to see how many conversions they drove.
This method also allows you easily change your attribution model. You can change the attribution weights to assign 100% to the first touch or the last touch to get different insights. Lastly, you can then join this to your revenue data to get to metrics like contribution margin by channel.
Benefits of Attribution Modeling
Every marketing team understands the implicit value that attribution modeling provides when it comes to overall decision-making, but very few actually understand the wider implications that it has when done correctly, so I’ve simplified the benefits into six key categories.
- Improved ROI: Attribution modeling gives your direct insight into which marketing channels are driving the most conversions so you can re-distribute your ad spend and allocate resources and marketing budget toward channels that yield the highest return
- Optimized A/B Testing: Attribution modeling allows you to run campaign variations so you can test performance to determine which touchpoints are most impactful in driving conversions.
- Increased Personalization and Segmentation: With attribution modeling, you can target specific audience cohorts based on their behavior to better understand how the impact of your channels on different audiences.
- Streamlined Customer Journey: Having direct visibility into your entire customer journey means you can identify potential gaps where customers are less likely to convert, so you can remove bottlenecks and improve your messaging.
- Better Alignment Between Teams: Attribution modeling bridges the gap between your sales and marketing teams so that you can measure the impact of marketing efforts versus sales outcomes. This coordinated approach means you can facilitate collaboration and communication between your teams to ensure everyone is working towards the same goals.
Final Thoughts
Attribution modeling isn’t getting any easier; in fact, it’s only becoming harder as marketing teams rapidly launch and experiment with campaigns across new channels.
Today’s’ customers want and expect personalized experiences, and traditional attribution platforms don’t provide the insight you need to power your marketing campaigns. SQL is the only tool that gives you the flexibility to build data-driven models so you can drive effective marketing strategies.
To learn more, feel free to book time with a Hightouch Solutions Engineer to talk about how to set up a SQL-based attribution model for your business.


